 Help Center
Help Center
Help Center
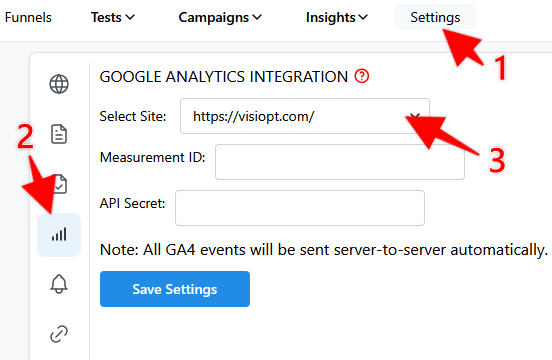
Log in to your Visiopt account, then go to the Settings page (1) > click on the Google Analytics Integration icon (2) > and select the desired site from the "Select site" drop-down (3):
Log in to your GA account, you will need to grab the Measurement ID, and set up an API secret key.
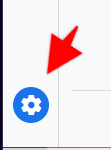
To find the Google Measurement ID, click on the Gear icon at the bottom of the left side bar:
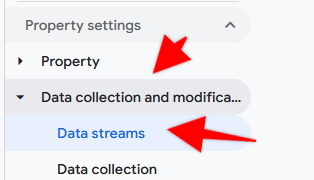
Click to expand the "Data collection and modification" section > select the "Data streams" option:
Click on the arrow icon:

Once all details are revealed, click on the Copy icon to copy the Measurement ID:

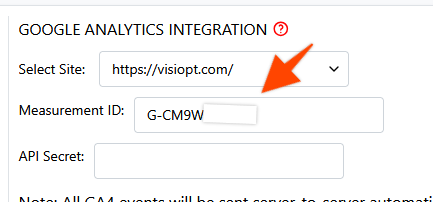
Head back to Visiopt and paste in the ID:
Head back to the GA account. Next, we will create a Secret API key.
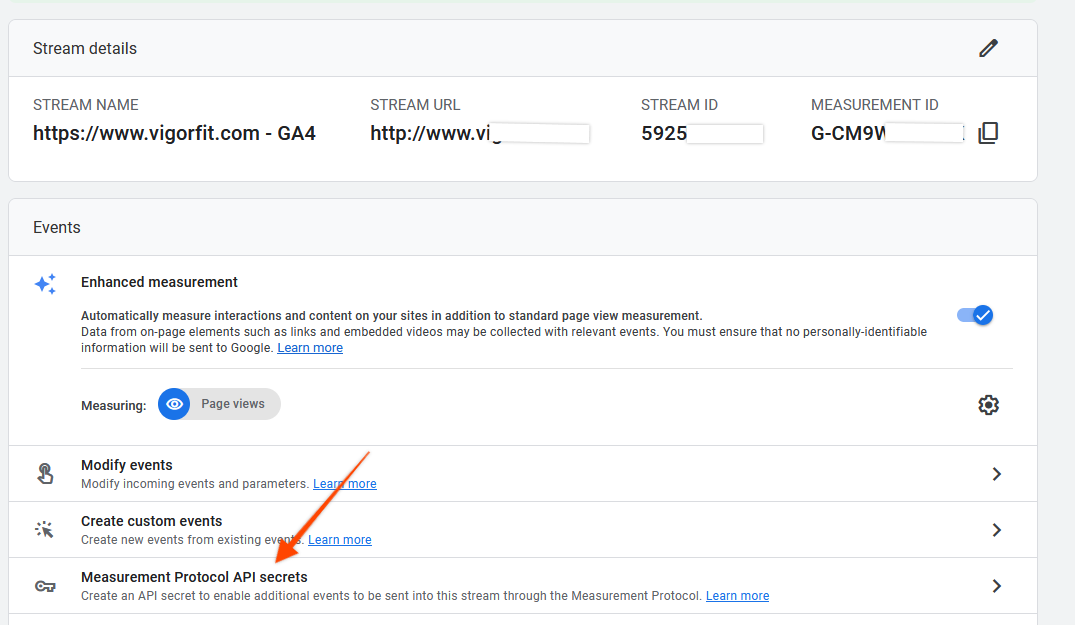
"Measurement Protocol API secrets" are found on the exact same page as the Measurement ID from the previous step. Click on it:
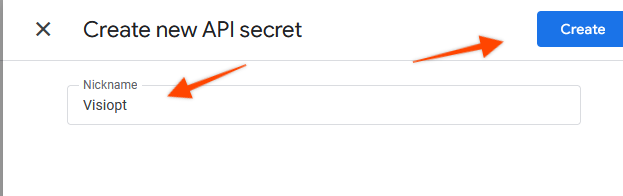
Click on the Create button:

Enter a name and hit Create:
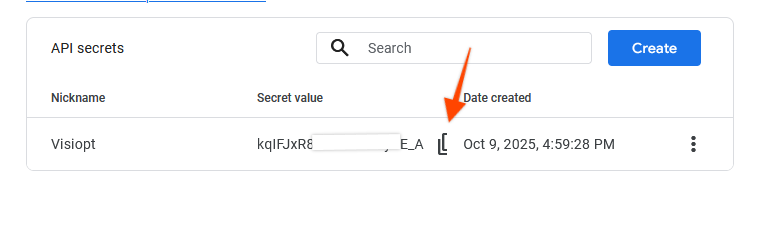
Hit the Copy icon to copy it.:
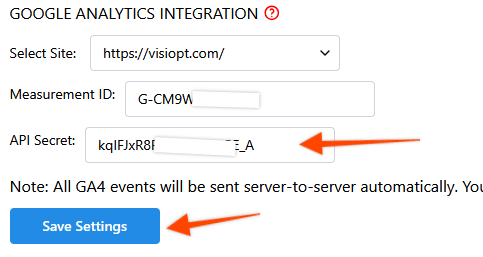
Head back to Visiopt, paste in the API number and hit Save Settings:
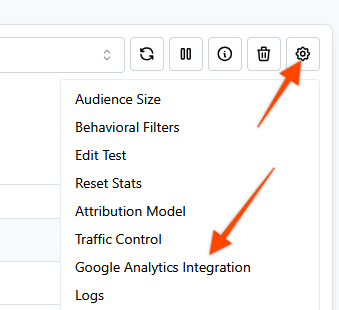
In your desired Visiopt test, click on the Gear icon > select Google Analytics Integration:
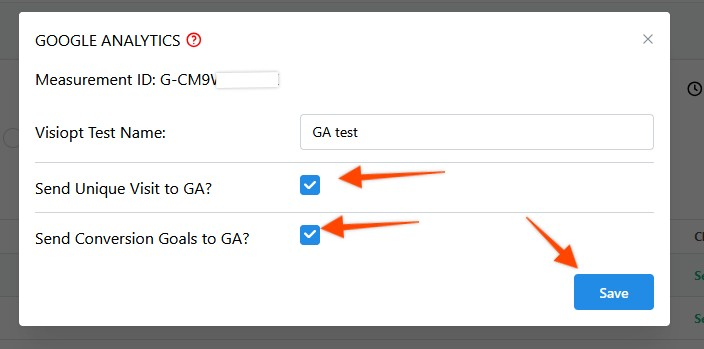
In the pop-up select what test data to send to GA and hit Save:
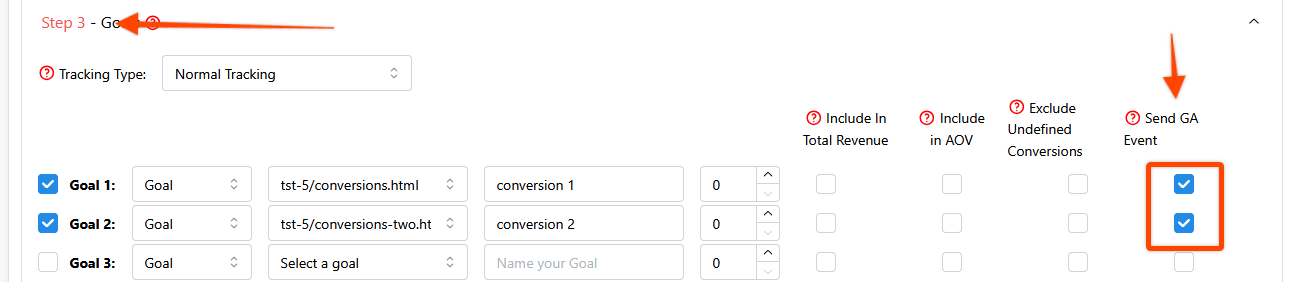
In Step 3 of the campaign setup, in the last column titled "Send GA Event", check the goals you want to send to GA:
From visiopt, we are sending three types of events to GA4.
1. visi_exposure
2. visi_goal
3. visi_campaign_goal
Visiopt sends data to Google Analytics 4 (GA4) at regular intervals to ensure your test and campaign metrics are synced accurately.
Visiopt pushes event data to GA4 every hour.
If an event has never been sent before, it may take up to 24–48 hours to appear in GA4 reports due to GA4’s processing latency.
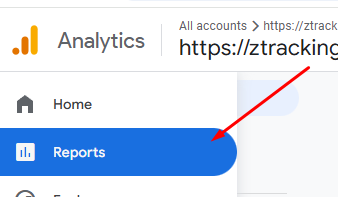
Go to Reports:
Then, Engagement > Events > there you will find your Visiopt goals:
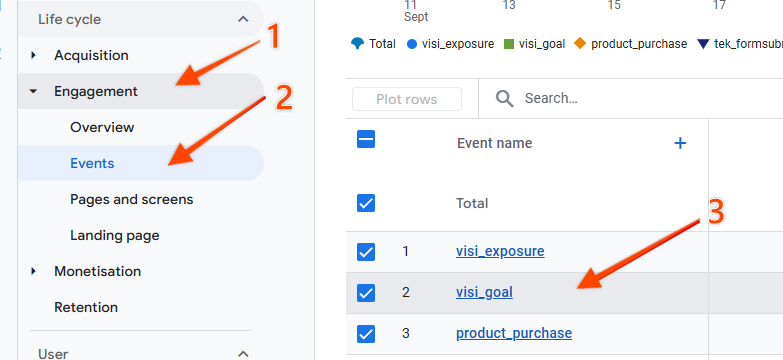
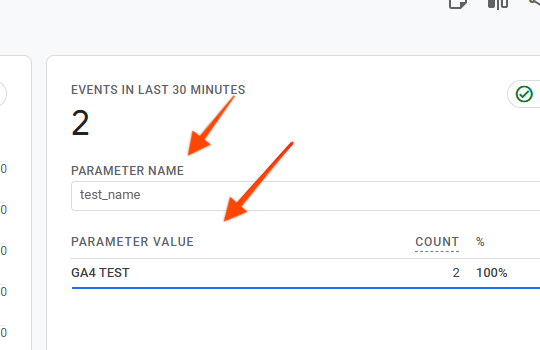
Click on the desired goal, select parameter name: test_name to see the vIsiopt test stats:
Or, select parameter name: test_variation to see the vIsiopt test variation stats:
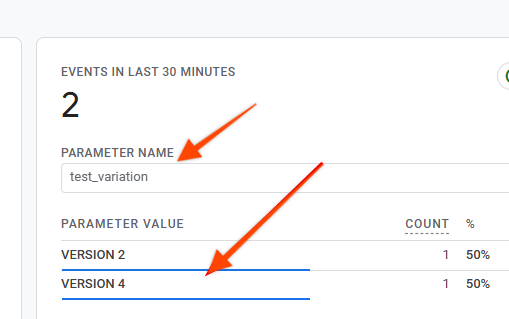
These show data from the last 30 minutes, including all event parameters sent from Visiopt.
Additionally (this is optional), you can set up custom exploration report.
Navigate to Explore and Create a new exploration:
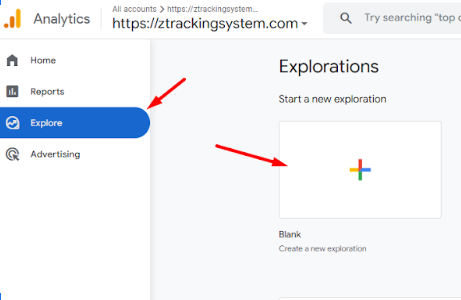
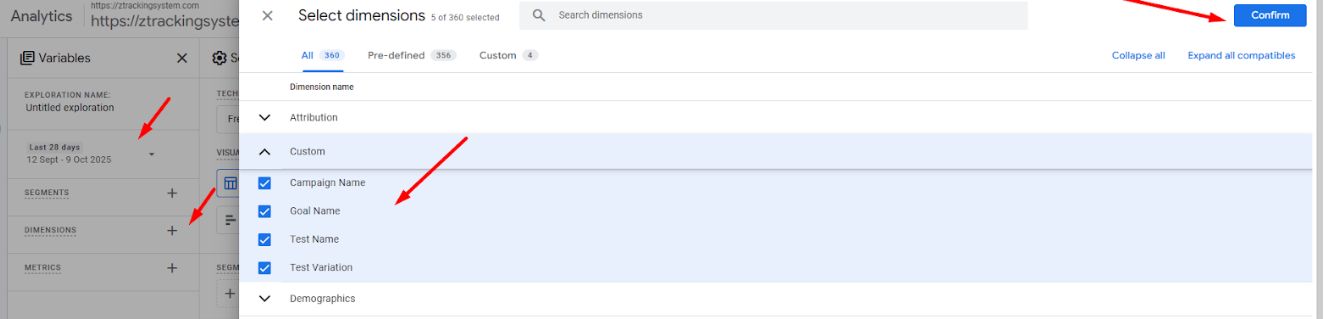
Here you can select the time range , dimensions which you want to display in the report:
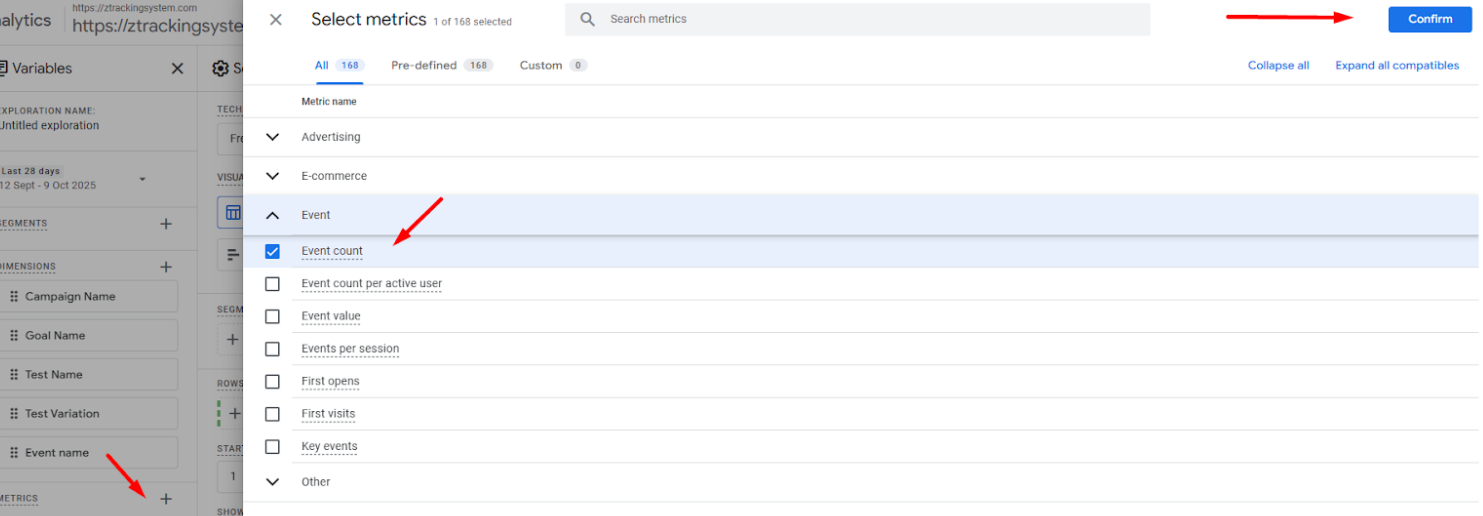
Also select metric Event Count which displays the count of events of specific events:
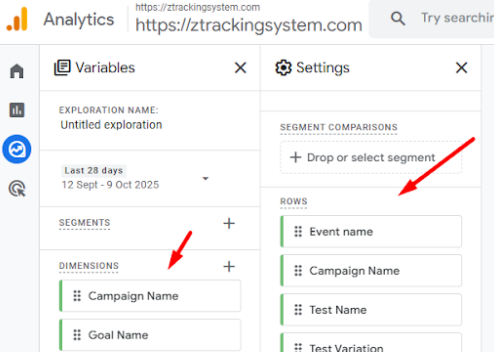
Drag & Drop the selected dimensions to rows and selected metrics to values:
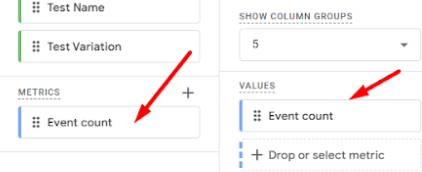
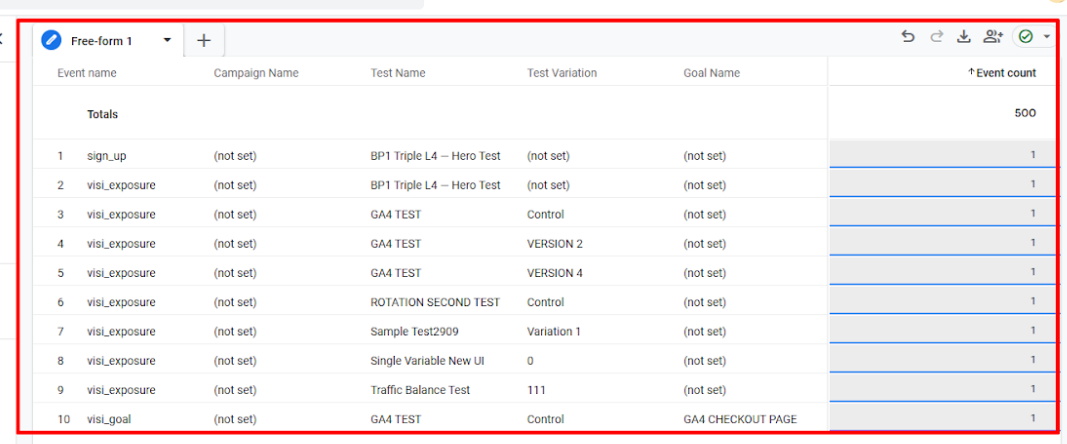
This will display the report table with event name, event count and with all the custom dimensions:
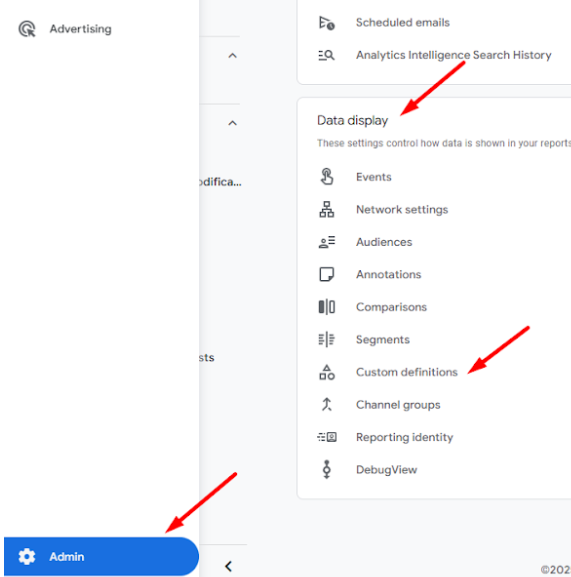
You can create custom dimensions to display in the exploration report of Ga4. Navigate to Admin - Data Display > Custom Definitions > Create custom dimension
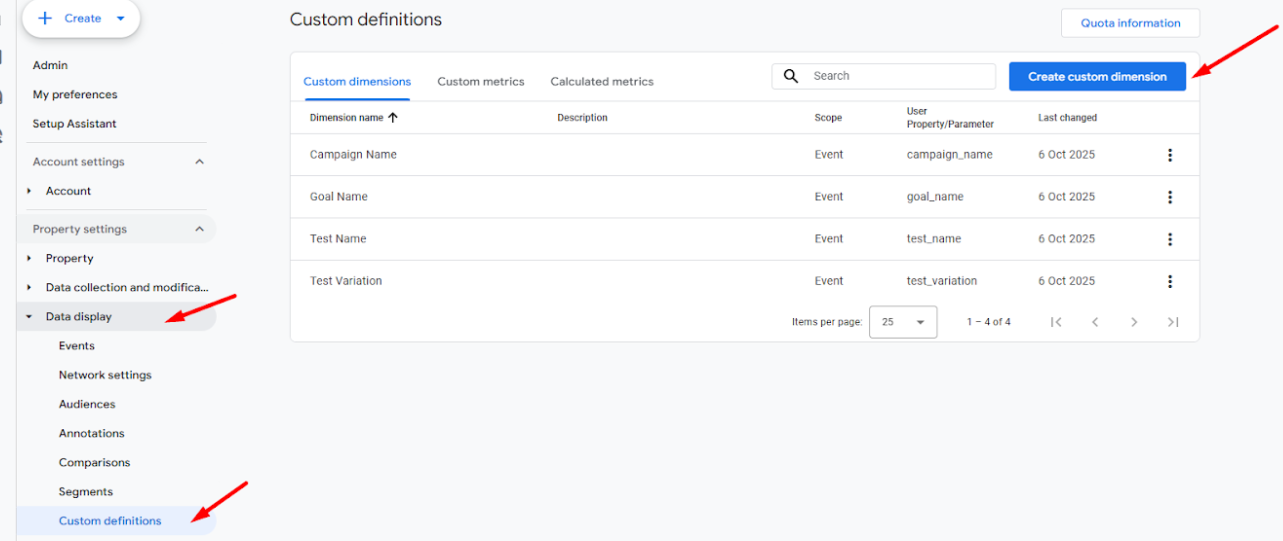
1. Campaign Name
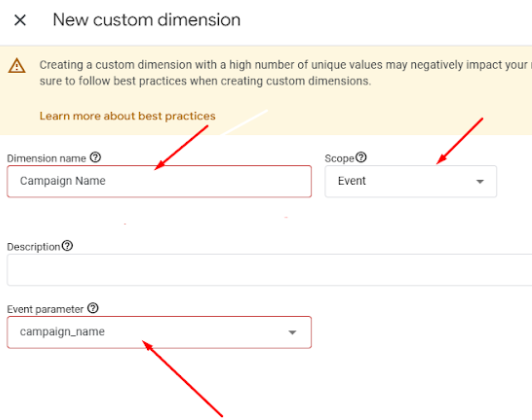
2. Goal Name
3. Test Name
4. Test Variation